
Is your Housing Market “seller-friendly”?
In 20 of the 35 largest U.S. metros, market conditions favor Buyers more than they do Sellers, according to Zillow.
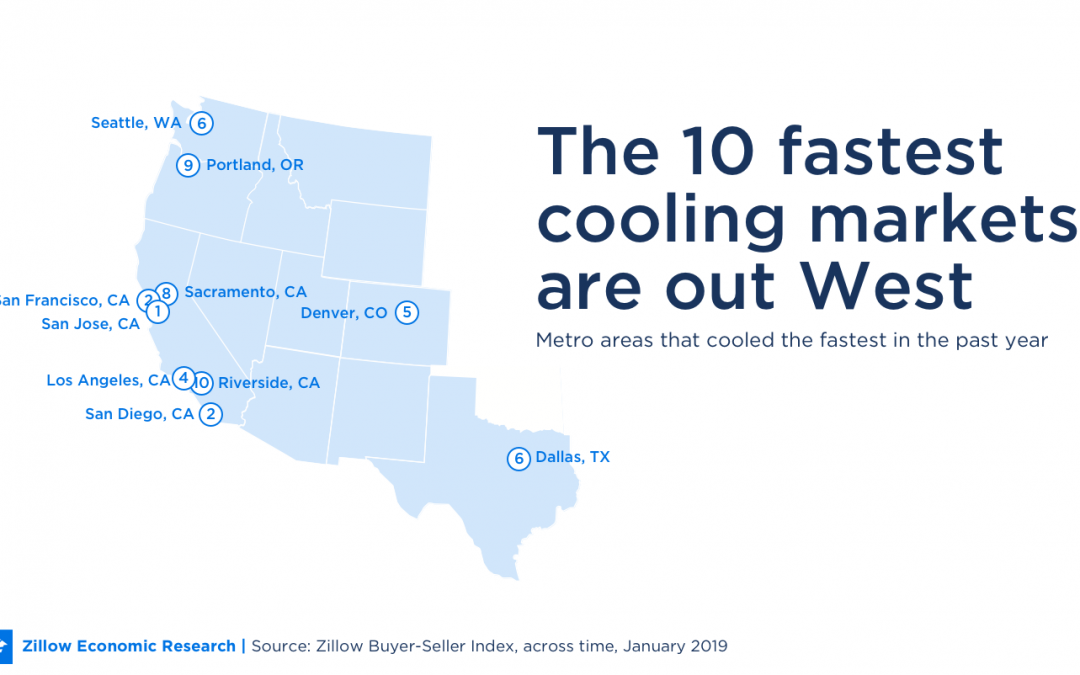
California markets have seen the biggest shift toward buyers since last January. San Jose leads the way. Followed by San Francisco, San Diego, Los Angeles, and Denver.
Those are the top five markets where buyers will have an easier time navigating the market.
Sacramento ranked #8 on the list…. after Dallas and before Portland.
On the flip side, the Miami, Houston and Pittsburg, PA markets are heating up. (for sellers)
We have the full list on the FACEBOOK Page / AskTheContractors.com
Show Prep Source: https://www.zillow.com/research/understanding-the-zillow-buyer-seller-index-2883/
Markets That Have Cooled (Ranked in Order of Biggest Cooldown)
| Metro |
Median Home Value |
Listings with a Price Cut |
Sale-to-List Price Ratio |
Days on Market |
| San Jose, CA | $1,245,800 | 15.3 | 97.2% | 61 |
| San Francisco, CA | $957,400 | 11.5 | 98.6% | 57 |
| San Diego, CA | $591,400 | 21.3 | 95.7% | 75 |
| Los Angeles-Long Beach-Anaheim, CA | $652,300 | 17.4 | 97.1% | 75 |
| Denver, CO | $405,300 | 18.1 | 97.2% | 65 |
| Dallas-Fort Worth, TX | $242,600 | 19.9 | 96.9% | 71 |
| Seattle, WA | $489,700 | 15.2 | 96.6% | 77 |
| Sacramento, CA | $408,700 | 17.3 | 96.9% | 67 |
| Portland, OR | $397,300 | 18.8 | 96.8% | 80 |
| Riverside, CA | $367,100 | 17.5 | 96.7% | 83 |
| Las Vegas, NV | $277,900 | 22.8 | 96.9% | 69 |
| Charlotte, NC | $206,200 | 16.8 | 96.9% | 71 |
| Tampa, FL | $213,600 | 23.2 | 95.6% | 75 |
| San Antonio, TX | $192,800 | 20.0 | 98.6% | 77 |
| Austin, TX | $308,200 | 19.1 | 95.1% | 74 |
| Kansas City, MO | $191,600 | 14.5 | 98.2% | 66 |
| Boston, MA | $467,000 | 15.5 | 97.1% | 74 |
| Chicago, IL | $224,800 | 18.2 | 94.2% | 102 |
| Columbus, OH | $189,900 | 16.5 | 96.6% | 71 |
| Atlanta, GA | $217,500 | 16.1 | 97.0% | 77 |
Markets That Have Heated Up (Ranked in Order of Biggest Increase)
| Metro |
Median Home Value |
Listings with a Price Cut |
Sale-to-List Price Ratio | Days on Market |
| Miami-Fort Lauderdale, FL | $283,800 | 16.7 | 93.9% | 99 |
| Houston, TX | $205,500 | 19.4 | 94.8% | 89 |
| Pittsburgh, PA | $143,900 | 16.8 | 93.7% | 87 |
| Philadelphia, PA | $232,700 | 17.9 | 95.7% | 90 |
| St. Louis, MO | $167,000 | 16.1 | 95.7% | 76 |
| Cincinnati, OH | $168,900 | 15.7 | 95.6% | 74 |
| Cleveland, OH | $145,600 | 15.5 | 94.5% | 82 |
| Phoenix, AZ | $264,900 | 19.2 | 97.4% | 61 |
| Detroit, MI | $160,000 | 17.5 | 94.7% | 78 |
| Indianapolis, IN | $163,900 | 17.9 | 97.0% | 70 |
| Orlando, FL | $237,100 | 20.4 | 95.8% | 84 |
| Baltimore, MD | $267,900 | 19.2 | 96.4% | 97 |
| New York, NY | $438,300 | 14.6 | 95.7% | 132 |
| Washington, DC | $406,200 | 14.8 | 97.4% | 82 |
| Minneapolis-St Paul, MN | $268,100 | 14.4 | 97.1% | 74 |
Do you have a news tip for our Show Prep on AsktheContractors.com? Send us a comment on the home page.
